A trade log
One row per trade: date, Buy or Sell, ticker, exchange, quantity, price, currency and fees. Room for 1,000 trades.
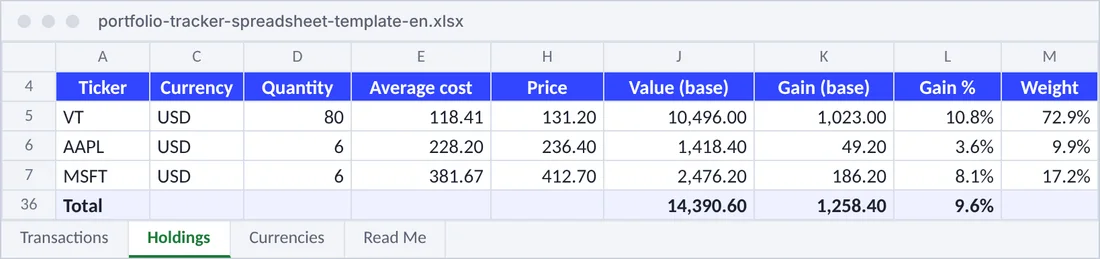
Log each buy and sell once. The Holdings sheet works out quantity, average cost, value, gain and weight per position, with prices from GOOGLEFINANCE in Google Sheets and a manual price column in Excel.
Built the way we would track a portfolio by hand. Nothing to buy, nothing locked.
Prefer not to share your email? Download it directly: same file.
Using Google Sheets? Make your own copy in one click.
.xlsx · about 25 KB · no macros · Google Sheets, Excel, LibreOffice
You log what you bought and sold. The sheet does the arithmetic.
One row per trade: date, Buy or Sell, ticker, exchange, quantity, price, currency and fees. Room for 1,000 trades.
Prices come from GOOGLEFINANCE using the ticker and exchange code. In Excel or LibreOffice, a manual price column takes over.
Average cost includes fees; quantity, cost basis, value, gain and gain % are worked out per position.
Each position’s share of the portfolio, with a pie chart.
Positions are converted into your base currency with GOOGLEFINANCE rates, or the manual rates on the Currencies sheet.
The Transactions sheet is the first sheet of the file, laid out so the portfolio tracker reads it with no column mapping.
Set it up once; after that you add a row when you trade.
Three example positions show it working. Delete their trades and keep the headings.
One row per buy or sell, with the exchange code Google Finance uses: NASDAQ, NYSE, ETR, EPA, AMS, SWX and so on.
On the Holdings sheet: ticker, exchange and currency. Everything else is computed from your trades.
Prices and exchange rates then update by themselves. In Excel, type the prices when you check.
Tracking more than investments? Copy this sheet’s total into the Investments row of the free net worth spreadsheet, and see where each month’s money goes with the budget spreadsheet.
The free portfolio tracker reads the Transactions sheet as it is and matches each ticker to its listing. Then every position is priced every day on 47 exchanges, currencies are converted with daily rates, and your cash, pensions and property sit in the same net worth. No broker login.
The template is complete on its own. These are the jobs a spreadsheet leaves to you.
| Portfolio spreadsheet | Portfolio tracker | |
|---|---|---|
| Prices | GOOGLEFINANCE in Google Sheets, typed in Excel; not every listing is covered | Every position priced daily, on 47 exchanges |
| London listings | Quoted in pence (GBX), divided by hand | Converted to pounds for you |
| History | Today’s value only, unless you copy it every month | Your portfolio’s value over time, rebuilt from your trades |
| Adding trades | Typed in, one row each | Imported from your broker’s export: Interactive Brokers, DEGIRO, Trading 212, Revolut, Scalable Capital, Swissquote, or any CSV |
| Dividends | Not tracked | Dividend calendar and income on Premium |
| Everything else you own | Not included | Cash, pensions, crypto and property in one net worth |
Yes. Download it, use it, share it and change it as you like. The email is optional: there is a direct download link under the form.
In Google Sheets, the Price column calls GOOGLEFINANCE with the exchange code and the ticker, for example NASDAQ:AAPL. Google Finance does not cover every listing and its quotes can be delayed; when it has no price, the manual price is used. Excel and LibreOffice have no GOOGLEFINANCE, so there the manual price column is used.
Every buy counts at its price plus its fees, divided by the shares bought. A sale lowers the quantity but not the average cost, so the cost basis is the remaining shares at that average.
Yes. Set your base currency on the Holdings sheet. Each position is converted with GOOGLEFINANCE exchange rates in Google Sheets, or with the manual rates on the Currencies sheet elsewhere.
No. The template follows trades, prices and gains. Dividend income and a dividend calendar are part of the portfolio tracker’s Premium plan.
Yes. The portfolio tracker on this site reads the Transactions sheet directly: create a free account, open the investment import and drop the file in. Dates, buys and sells, tickers, quantities and prices are recognised.
Download the template, log your trades and open it in Google Sheets. When updating prices gets old, the portfolio tracker imports the whole file.
The trades, prices and amounts in the template and the screenshot are examples, not recommendations. Nothing here is financial advice.